BaiduMapChart调用说明:
1. BaiduMapChart依赖库:
依赖库:
jquery.min.js, bootstrap.min.js, underscore-min.js, crossfilter.js, d3.min.js, dc.js, queue.js, leaflet.js,
leaflet-heat.js, leaflet-baidu.js, baiduMapAPI-2.0-min.js
百度地图chart下载:BaiduMapChart
2. 创建:
代码示例:
var mapChart = dc.BaiduMapChart("#map");3. 调用:
代码示例:
mapChart
	.width(900)
	.height(600)
	.dimension(allDim)
	.center([31.207391, 121.608203])
	.maptyppe('bluish')
	.zoom(11);
4. api说明:
函数dimension()
参数为crossfilter中的dimension变量。
函数center()
传入数据格式为[纬度,经度],定义地图中心点的坐标。
函数zoom()
传入一个数字,作用是调整地图缩放比例。(在leaflet-baidu.js中规定范围为[3,19])
函数maptype()
传入数据应该为字符串,规定默认加载地图格式,目前包括:normal,satellite,road,cnormal,light,dark,redalert,googlelite,grassgreen,midnight,pink,darkgreen,bluish,grayscale,hardedge共15种。
不同模式地图展示示例如下:
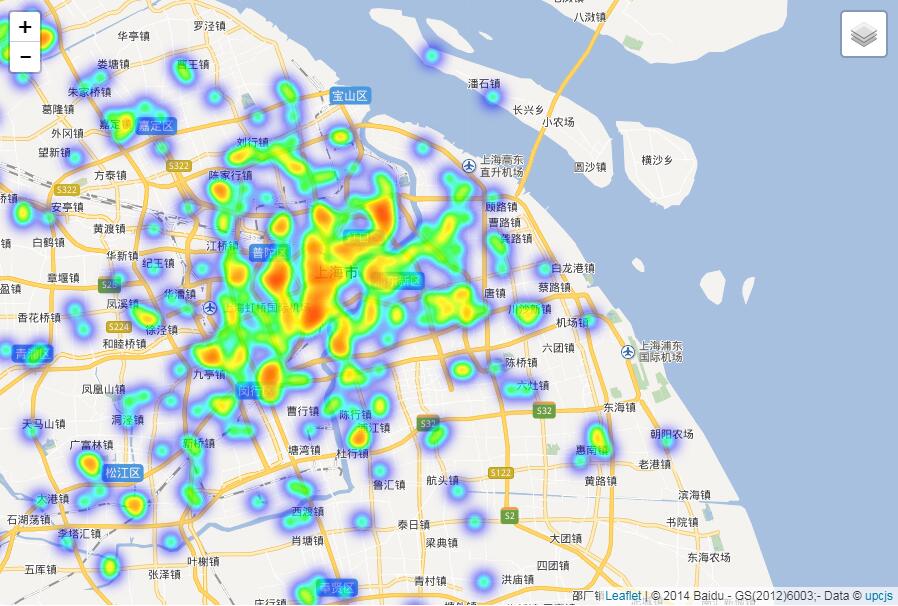 | 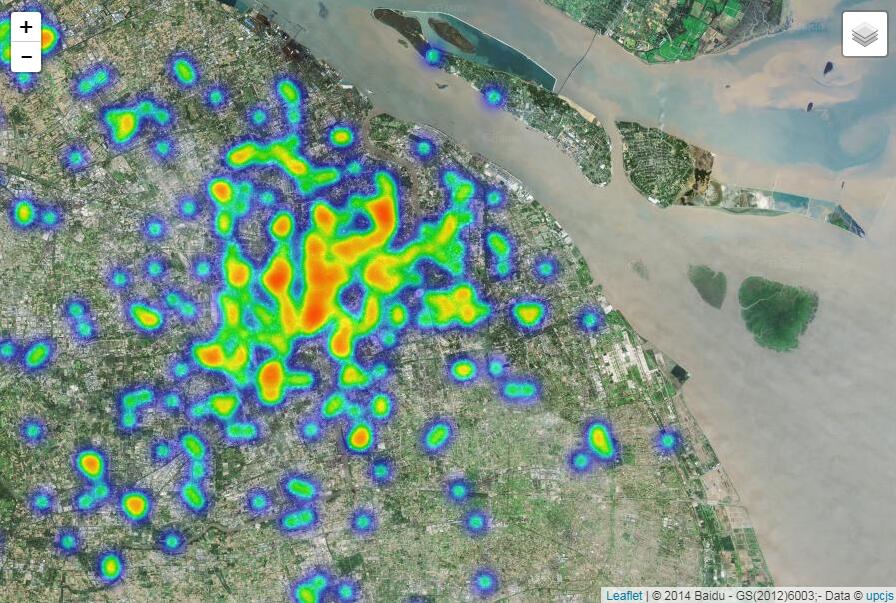 | 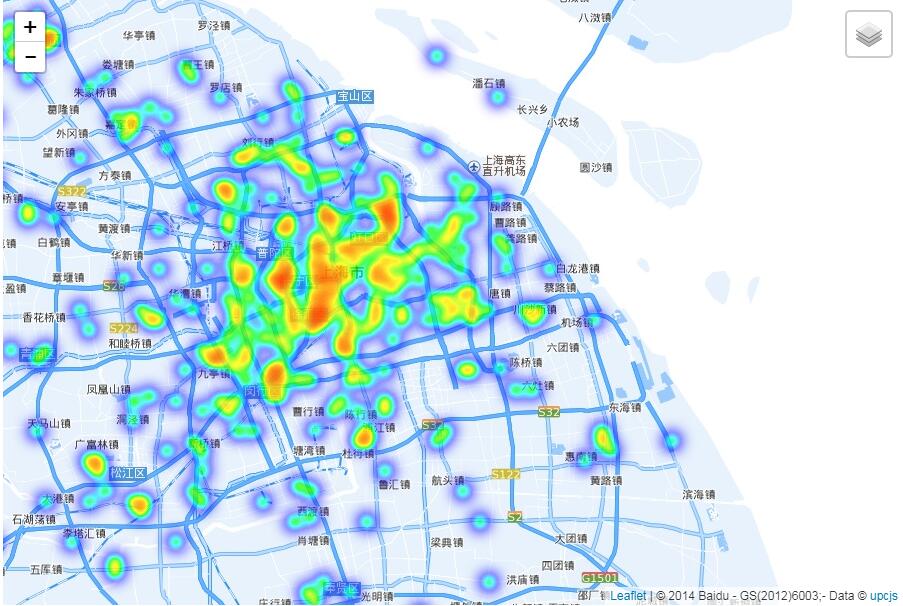 |
|---|---|---|
| normal模式 | satellite模式 | bluish模式 |
完整代码:
xxxxxxxxxx1311<!DOCTYPE html>2<html>3<head>4 <title>BaiduMapChart example</title>5 <link rel="stylesheet" href="/static/lib/css//bootstrap.min.css">6 <link rel="stylesheet" href="/static/lib/css/keen-dashboards.css">7 <link rel="stylesheet" href="/static/lib/css/dc.min.css">8 <link rel="stylesheet" href="/static/lib/css/leaflet.css">9 <link rel="stylesheet" href="/static/css/custom.css">10</head>11<body class="application">1213 <div class="navbar navbar-inverse navbar-fixed-top" role="navigation">14 <div class="container-fluid">15 <div class="navbar-header">16 <a class="navbar-brand" href="./">BaiduMapChart example</a>17 </div>18 </div>19 </div>2021 <div class="container-fluid">22 <div class="row">23 <div class="col-sm-6">24 <div class="row">25 <!-- Time Chart -->26 <div class="col-sm-12">27 <div class="chart-wrapper">28 <div class="chart-title">29 Number of Events30 </div>31 <div class="chart-stage">32 <div id="time-chart"></div>33 </div>34 </div>35 </div>36 </div>37 <!--</div>-->38 <!--<div class="col-sm-4">-->39 <div class="row">40 <!-- Map -->41 <div class="col-sm-32">42 <div class="chart-wrapper">43 <div class="chart-title">44 Map45 </div>46 <div class="chart-stage">47 <div id="map" ></div>48 </div>49 </div>50 </div>51 <!-- Map -->52 </div>53 </div>54 </div>5556 </div>5758 <hr>59 <p class="small text-muted">Built with ♥ by <a href="https://upcjs.github.io">upcjs.github.io</a></p>6061 <script src="/static/lib/js/jquery.min.js"></script>62 <script src="/static/lib/js/bootstrap.min.js"></script>63 <script src="/static/lib/js/underscore-min.js"></script>64 <script src="/static/lib/js/crossfilter.js"></script>65 <script src="/static/lib/js/d3.min.js"></script>66 <script src="/static/lib/js/dc.js"></script>67 <script src="/static/lib/js/queue.js"></script>68 <script src="/static/lib/js/leaflet.js"></script>69 <script src="/static/lib/js/leaflet-heat.js"></script>70 <script src="/static/lib/js/leaflet-baidu.js"></script>71 <script src="/static/lib/js/baiduMapAPI-2.0-min.js"></script>72 <script src="/static/upcjs/BaiduMapChart.js" type='text/javascript'></script>73<script>74 queue()75 .defer(d3.json, "./data.json")76 .await(makeGraphs);7778function makeGraphs(error, recordsJson) {79 var records = recordsJson;80 var dateFormat = d3.time.format("%Y-%m-%d %H:%M:%S");8182 records.forEach(function(d) {83 d["timestamp"] = dateFormat.parse(d["timestamp"]);84 d["timestamp"].setMinutes(0);85 d["timestamp"].setSeconds(0);86 d["longitude"] = +d["longitude"];87 d["latitude"] = +d["latitude"];88 });8990 //Create a Crossfilter instance91 var ndx = crossfilter(records);9293 //Define Dimensions94 var dateDim = ndx.dimension(function(d) { return d["timestamp"]; });95 var locationdDim = ndx.dimension(function(d) { return d["location"]; });96 var allDim = ndx.dimension(function(d) {return d;});9798 //Group Data99 var numRecordsByDate = dateDim.group();100101 //Define values (to be used in charts)102 var minDate = dateDim.bottom(1)[0]["timestamp"];103 var maxDate = dateDim.top(1)[0]["timestamp"];104 //Charts105 var timeChart = dc.barChart("#time-chart");106 var mapChart = dc.BaiduMapChart("#map");107108 mapChart109 .width(900)110 .height(600)111 .dimension(allDim)112 .center([31.207391, 121.608203])113 .maptyppe('bluish')114 .zoom(11);115116 timeChart117 .width(900)118 .height(80)119 .margins({top: 10, right: 50, bottom: 20, left: 20})120 .dimension(dateDim)121 .group(numRecordsByDate)122 .transitionDuration(500)123 .x(d3.time.scale().domain([minDate, maxDate]))124 .elasticY(true)125 .yAxis().ticks(4);126127 dc.renderAll();128};129</script>130</body>131</html>致谢:
在地图调用过程中使用到了leaflet插件
调用百度地图还需要百度地图的api
感谢Tiven制作的leaflet百度地图
版权: 中国石油大学华东可视分析小组
联系人:李昕 邮箱:lix@upc.edu.cn